Over the years I’ve had several different time & temperature weather stations which gave the current outdoor temperature and humidity but were a bit thin on capturing historic data. I’ve considered buying a fancier weather station which connects to a PC for logging… but those are pricy and require a PC be connected and on. An Arduino, on the other hand, is wicked cheap and tons of people use them as the brains behind their weather stations (IOW: lots of example code is out there to be had).
It’s fairly common to log data from an Arduino to an SD card, but that would require periodically pulling the card and downloading the data for review. I knew I didn’t want that level of effort so went looking for a way to push the data up to some place on the interwebs. I had all but given up on finding an easy solution when I came across COSM.

COSM is a nifty web service which allows developers to push data to the cloud and visualize the result. The service is free to use for basic logging and visualizations but their true raison d’être is a cloud service for the mythical coming of the IoT (internet of things). Hardware developers can use COSM to onboard and manage devices in their product line. I’m unlikely to ever need their cool pay services, but I do appreciate the ability to put meteorological data in the side bar of my website.
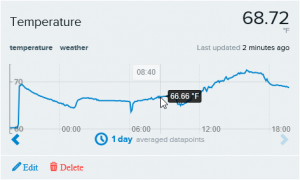
COSM has a chunk of sample code that makes it really easy to get started pushing data to them from an Arduino. Because you can push the data directly from your Arduino (provided you have a network interface of some sort) you don’t need to be running a power-hungry PC 24/7 to indulge your inner data nerd. Keeping an eye on your data is easy too with nice data presentation via their dashboard (picture above) or you can embed live, auto updating graphs using nifty image tags. Here are a couple of graphs, first for temperature and second for air pressure:
)
)
Now, if I can just figure out a way to use the anemometer from the cheap weather station I bought off Woot…
[Edit: as of May 14, 2013, COSM has changed its name to Xively]
One reply on “Easy visualizations for your Arduino data”
Extremely interesting and useful content. Book-marked … Many thanks for the amazing read.